




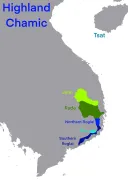





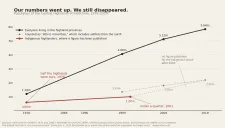

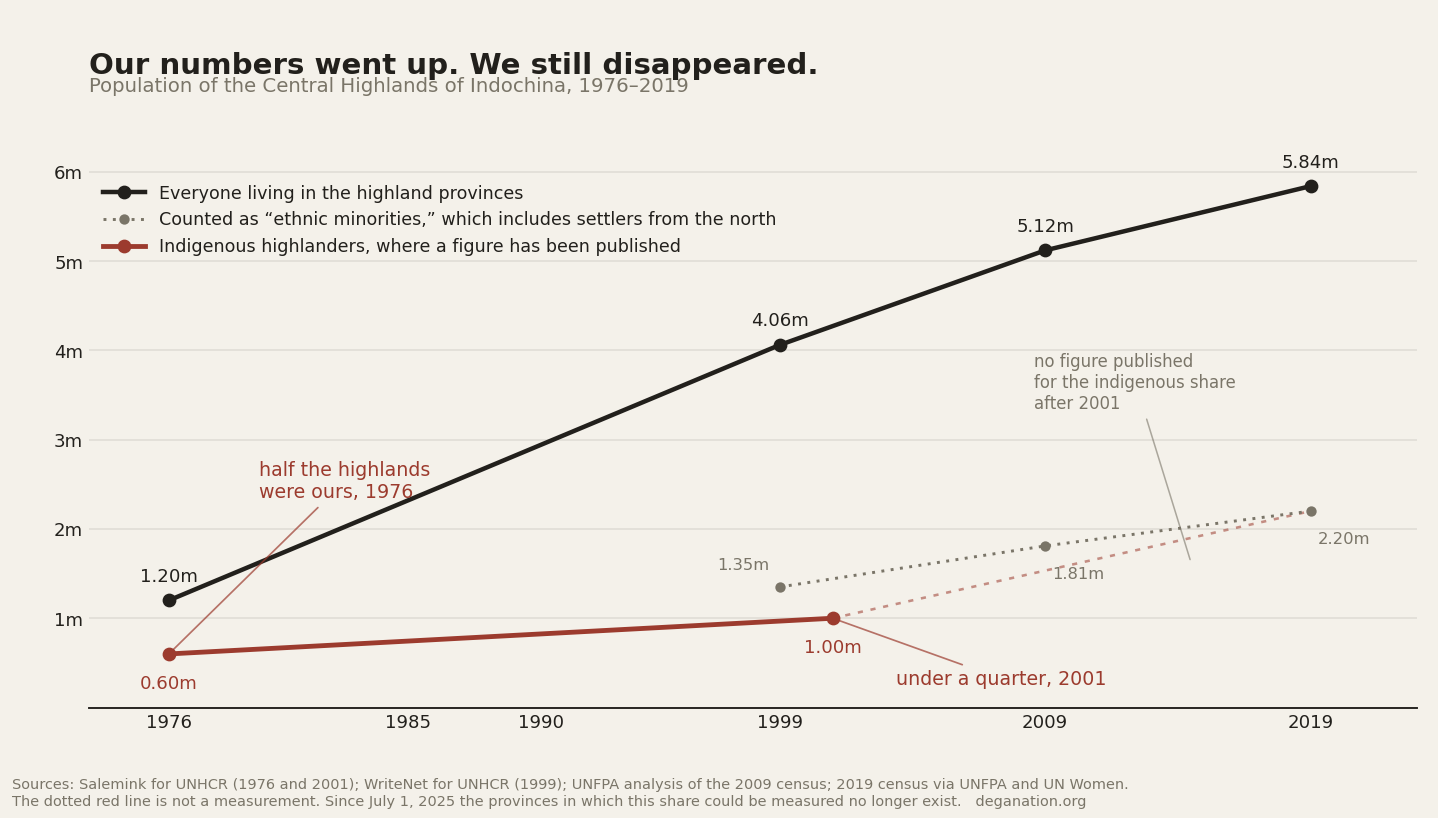
There are more of us than there have ever been, and we have never been so small a part of our own country. The state’s own census counted about 768,000 people in the thirteen highland peoples in 1979 and about 2,125,000 in 2019 — almost a trebling in forty years. Over the same span the population of the four highland provinces went from 1.2 million to more than 5.8 million, and the share of that population that was indigenous fell from about a half to about a quarter. Both halves of that sentence are the story. And since July 1, 2025 the provinces in which the share could be measured no longer exist.
Four numbers, all of them honest
Ask how many Dega there are and you will be given a figure between half a million and three and a half million. The range is not evidence that somebody is lying. It is evidence that the question has not been settled — who is counted, where they are counted, and by whom.
| Figure | Who publishes it | What it actually counts |
|---|---|---|
| about 2,125,000 | Arithmetic on the 2019 census: the thirteen peoples indigenous to the plateau | Everyone the state assigns to those thirteen dân tộc categories, wherever in Vietnam they live |
| about 2,566,000 | The same arithmetic, adding the six peoples of the Annam Cordillera that Oscar Salemink counted with us | As above, on the wider definition used in the UNHCR literature |
| about 1,000,000 | Human Rights Watch, Repression of Montagnards (2002), p. 13; Salemink for UNHCR (2001) | Indigenous highlanders resident in the highland provinces at the turn of the century |
| 1 to 2 million | Minority Rights Group International, World Directory of Minorities and Indigenous Peoples (2018) | “The Montagnards of the central highlands,” undefined |
| 3 to 3.5 million | Our own records, for the colonial period | The whole highland population before the wars. No outside count comes near it. See below |
The first and the third are not rivals. One counts a set of state categories across the whole country; the other counts people inside a region. A Rhade in Phú Yên, a Raglai in Ninh Thuận, a Stieng in Bình Phước and a Bru in Quảng Trị are in the first number and in none of the others. Once you know which question each figure answers, four of these five stop contradicting one another.
The fifth needs saying carefully, because we have not been able to make it agree with anything else. Every count made by an outsider between 1953 and 1974 — by the State of Vietnam, by the Republic of Vietnam, by the American army, by the Central Intelligence Agency, by a think tank, and by the one anthropologist who disputed all of them — falls between about 460,000 and about 1,000,000. A highland population of three million in the 1940s would require a collapse of three quarters and then a recovery to 2.1 million, and no demographic model produces that shape.
It is worth saying plainly what those counters were. Every one of them was an administration counting a people it governed or meant to govern, in a country where it could not travel safely into most of our villages, and every one of them had a reason to prefer the smaller number, because a smaller people is a smaller claim. The American handbook of 1966 admits as much in its own pages about the Mnong, where Saigon’s estimates ran low and Hanoi’s ran high. None of that makes three million right. It does mean that the wall of figures standing against it is not a neutral wall. What would settle it is knowing what our own figure was built from and who built it, and we would be glad to hear from anyone who knows.
The instrument
Vietnam counts fifty-four peoples. The list was fixed by a decision of the General Statistics Office numbered 121-TCTK/PPCD, the Nomenclature of Vietnamese Ethnic Groups, dated March 2, 1979, and the World Bank’s 2009 country social analysis of ethnicity in Vietnam states flatly that the classification has not been revised since. Every census figure on this page is produced by that instrument, and the instrument is nearly fifty years old.
The same World Bank study describes how the list was made. The criteria were Soviet: language, material life and culture, and “ethnic consciousness.” Where communities disagreed with the classification proposed for them, the disagreement was settled from outside rather than by asking; researchers sometimes imposed identities; and some locally used names were, in the report’s words, discarded or changed by government ethnologists. That is a development bank describing the machinery, not an exile organization complaining about it.
What the machinery does to us is straightforward. It lumps, it splits, and it has no word for the whole.
| State category | Holds, among others | Consequence |
|---|---|---|
| Xơ Đăng | Xteng, Todrah, Monom, Halang, Kayong | The 1966 American handbook treats the Halang as a people of 30,000 in South Vietnam and 10,000 in Laos. The census has no Halang row |
| Cơ Ho | Sre, Nop, Cil, Lat, To La, C’don, T’ring | The same handbook counted about 90,000 Koho across these, and counted the Ma among them |
| Mnông | Gar, Nong, Preh, Rlam, Bu Dang | The Mnong of Mondulkiri are the same people, counted in Cambodia as Bunong |
| Giẻ Triêng | Gie, Trieng, Ve, Bnoong | Two names welded into one row |
| Ba Na | Jơlơng, Rơngao, Gơlar, KonKde, Kriem, Tơlô, Bơnâm, Roh | The Rengao are about ten thousand people with a language code of their own and no census row |
| Bru-Vân Kiều | Bru, Van Kieu, Khua, Ma Coong, Tri | |
| Gia Rai | Seven named subgroups in the literature of the 1960s |
And one that goes the other way. The Ma are a people of their own in the state list, while the American handbook of 1966 put them inside the Koho at twenty to thirty thousand. Whether the Ma are Koho is exactly the kind of question the list answers by fiat. See The tribes and their languages and Koho, Maa, Churu and Raglai.
Here is the mapping, for anyone working with the tables.
| We say | The state says | Other forms in the record |
|---|---|---|
| Jarai | Gia Rai | Djarai, Jrai, Charay |
| Rhade | Ê Đê | Ede, Rade, Radhe, Rhadé |
| Bahnar | Ba Na | Bana, Bahnar |
| Sedang | Xơ Đăng | Xo Dang, Xodang, Sơdang |
| Koho | Cơ Ho | K’Ho, Kaho, Coho, Kohov |
| Mnong | Mnông | Bunong, Phnong, Pnong, Bnong |
| Stieng | Xtiêng | X’Tieng, Budip, Bu Lo |
| Raglai | Ra Glai | Raglay, Roglai, Orang Glai |
| Churu | Chu Ru | Chru, Churu |
| Gie-Trieng | Giẻ Triêng | Jeh-Tariang, Gie, Trieng, Ve, Bnoong |
| Ma | Mạ | Maa |
| Ro Mam | Rơ Măm | Romam |
| Brau | Brâu | Brao, Brou |
There is no census category for Dega, for Montagnard, for Anak Ea Cin, or for anything else that names us together. That is not an oversight. A collective name would imply a collective subject, and a collective subject can have collective claims. The arithmetic on this page is something we have to do row by row for ourselves, because the instrument is built so that nobody else will do it.
How little the instrument yields when it is asked a direct question can be seen in Vietnam’s own reporting to the United Nations. In its combined fifteenth to seventeenth periodic report to the Committee on the Elimination of Racial Discrimination, submitted on January 13, 2021, Vietnam described a country of 96,209,000 people in sixty-three provinces and cities, composed of fifty-four ethnic groups, of whom 14,119,000 people belonging to fifty-three ethnic minorities live in 3.6 million households in ethnically mixed communities across fifty-one provinces and cities, 548 districts and 5,266 communes. Fourteen and a half percent of the country. Asked by a treaty body to account for its treatment of fifty-three peoples, the state reported one number and no breakdown at all. See The UN record.
Five censuses, people by people
This is the forty-year series. The 1979, 1989 and 1999 columns are from the World Bank’s table of all fifty-four groups; the 2009 and 2019 columns are the published census results as carried in the reference literature. The final column is the multiple of the 1979 figure.
| People | State name | 1979 | 1989 | 1999 | 2009 | 2019 | ×1979 |
|---|---|---|---|---|---|---|---|
| Jarai | Gia Rai | 184,507 | 242,291 | 317,557 | 411,275 | 513,930 | 2.79 |
| Rhade | Ê Đê | 140,884 | 194,710 | 270,348 | 331,194 | 398,671 | 2.83 |
| Bahnar | Ba Na | 109,063 | 136,859 | 174,456 | 227,716 | 286,910 | 2.63 |
| Sedang | Xơ Đăng | 73,092 | 96,766 | 127,148 | 169,501 | 212,277 | 2.90 |
| Koho | Cơ Ho | 70,740 | 92,190 | 128,723 | 166,112 | 200,800 | 2.84 |
| Raglai | Ra Glai | 57,984 | 71,696 | 96,931 | 122,245 | 146,613 | 2.53 |
| Mnong | Mnông | 45,954 | 67,340 | 92,451 | 102,741 | 127,334 | 2.77 |
| Stieng | Xtiêng | 40,763 | 50,194 | 66,788 | 85,436 | 100,752 | 2.47 |
| Gie-Trieng | Giẻ Triêng | 16,824 | 26,924 | 30,243 | 50,962 | 63,322 | 3.76 |
| Ma | Mạ | 20,264 | 25,436 | 33,338 | 41,405 | 50,322 | 2.48 |
| Churu | Chu Ru | 7,738 | 10,746 | 14,978 | 19,314 | 23,242 | 3.00 |
| Ro Mam | Rơ Măm | 143 | 227 | 352 | 436 | 639 | 4.47 |
| Brau | Brâu | 95 | 231 | 313 | 397 | 525 | 5.53 |
| Thirteen peoples | 768,051 | 1,015,610 | 1,353,626 | 1,728,734 | 2,125,337 | 2.77 |
Six more peoples of the Annam Cordillera are counted with us in the UNHCR literature, and the wider figure is the one that appears in the refugee reporting.
| People | State name | 1979 | 1989 | 1999 | 2009 | 2019 | ×1979 |
|---|---|---|---|---|---|---|---|
| Hre | Hrê | 66,884 | 94,259 | 113,111 | 127,420 | 149,460 | 2.23 |
| Bru | Bru-Vân Kiều | 33,090 | 40,132 | 55,559 | 74,506 | 94,598 | 2.86 |
| Katu | Cơ Tu | 26,993 | 36,967 | 50,458 | 61,588 | 74,173 | 2.75 |
| Ta Oi | Tà Ôi | 20,517 | 26,044 | 34,960 | 43,886 | 52,356 | 2.55 |
| Co | Co | 16,828 | 22,649 | 27,766 | 33,817 | 40,442 | 2.40 |
| Chrau | Chơ Ro | 7,090 | 15,022 | 22,567 | 26,855 | 29,520 | 4.16 |
| Six peoples | 171,402 | 235,073 | 304,421 | 368,072 | 440,549 | 2.57 | |
| All nineteen | 939,453 | 1,250,683 | 1,658,047 | 2,096,806 | 2,565,886 | 2.73 |
The check that shows the table is sound
Oscar Salemink, writing for UNHCR in 2001, reported that the indigenous population of the Central Highlands and the Annam Cordillera below the seventeenth parallel “grew by 76 per cent from 925,000 to 1,625,000 in twenty years time.” Our sum of the same nineteen peoples gives 939,453 for 1979 and 1,658,047 for 1999 — within two percent of his figures at both ends, and a growth of 76.5 percent against his 76. Two independent routes to the same series. It also tells us exactly which peoples he had in mind, which is worth more than the agreement itself, because the wider and narrower definitions are the reason two honest sources can differ by four hundred thousand people.
Anyone reproducing these tables should know that a figure of 1.5 to 1.7 million is often attached to the 2019 census. It is the 1999 total: 1,353,626 on the narrow definition, 1,658,047 on the wide one. The year moved forward and the number did not.
What the growth column does and does not mean
Every one of the nineteen roughly trebled in forty years, faster than Vietnam as a whole, which went from 52.7 million in 1979 to 96.2 million in 2019 — a multiple of 1.83. Nothing in that column says the highlands got better.
Salemink’s report for UNHCR records that in the years 1993 to 1998 the average household size of indigenous Central Highlanders became the largest of any statistically significant group in Vietnam — 6.68 people, almost two above the national average — and that in 1989 life expectancy for the Jarai was 54.4 years, more than thirteen years below the life expectancy of Kinh. High fertility and short lives are what a trebling in forty years records. It is the demography of a poor and unwell population, not a flourishing one. See How we died.
Part of the rise is also the enumerator arriving somewhere he had not been. The 1979 census was taken four years after the war ended, in a region still under military administration. Look at the Gie-Trieng line: 16,824, then 26,924 a decade later, then 30,243, then a jump to 50,962 that no birth rate explains. And part of it is people changing what they declare, in both directions, for reasons that have to do with school places, land, and what it is safe to be.
Before the censuses
Between 1953 and 1974 the people counting us were an intelligence service, a defense think tank, an army ethnographic office and a statistical yearbook, and they did not agree with one another either.
The Central Intelligence Agency, in a June 1966 review of political developments in the highlands, put the position without decoration: “There are no accurate population figures for the area, with estimates of Highlanders ranging from 500,000 to 1,000,000.” Its own working figure, in the same study, was “about 700,000” in approximately twenty-two groups.
Joseph M. Carrier, writing in February 1974 for the American National Academy of Sciences study of herbicides in South Vietnam, had to estimate how many highlanders had been under the spraying, and began by observing that no complete census of this population had ever been made and that the estimates ran “from a low of about 460,000 to a high of a little over one million.” He set out the Republic of Vietnam’s own series: 464,354 in 1968, 599,233 in 1970, 679,604 in 1971, against a Special Commission estimate of 642,855 for 1965.
Gerald C. Hickey did not believe any of it. In a RAND paper of 1969 he wrote:
“There are estimated to be at least 1,000,000 Chinese, 500,000 Khmer and 50,000 Cham. The Vietnamese government reports 642,855 Highlanders, but figures compiled in the Highlands by me in collaboration with the Summer Institute of Linguistics researchers, some missionaries, and some local officials total close to 1,000,000.”
That is the origin of the “about a million” that has been repeated for fifty years. It is 1969, it is a RAND paper, and Hickey names the figure he is disputing and says how he got his own: by going to the villages with linguists, missionaries and local officials. It remains, as far as we can establish, the last time anybody who was not a government tried to count us. That was more than fifty-five years ago.
The per-people estimates of the war years are far below what the censuses would later find, which means either that we grew very fast or that the war-era counts missed most of us. Hickey’s own survey for the Advanced Research Projects Agency in April 1964 gave 137,549 Jarai and 57,376 Sedang and 17,162 Stieng and 15,876 Mnong from South Vietnamese government figures of 1960, 120,000 Rhade from two recent sources, and 80,000 Bahnar from a 1952 estimate. The United States Army’s ethnographic handbook of 1966 gave approximately 150,000 Jarai, between 100,000 and 120,000 Rhade, about 90,000 Koho, between 40,000 and 80,000 Sedang, approximately 40,000 Raglai, and for the Bahnar a range so wide it admits defeat: “Although no accurate records exist, the Bahnar population was estimated at 80,000 in 1952, but estimates for 1960 indicated that they may number as many as 200,000.”
The single most revealing sentence in that handbook is in its chapter on the Mnong.
“The M’nong population has been estimated at between 15,000 and 40,000: South Vietnamese estimates tend toward the lower figure; North Vietnamese estimates, toward the higher. The discrepancy can perhaps be accounted for by the considerable number of M’nong who live in Cambodia, believed by a recent source to be about 15,000.”
Two governments at war over our country, counting the same people, arriving at figures that differ by a factor of nearly three, each in the direction that suited it. The handbook’s explanation is a polite one and may well be right. It does not change what the sentence records: our number was a political quantity in 1966, before any of the censuses on this page were taken. See The Mnong.
One more sighting of the low end, from an unexpected direction. Stan B-H Tan, writing on state formation in the highlands under the First Republic, reports that by June 1959 a total of 80,159 highlanders had been settled in 108 sedentarization centers, and that this amounted to about 17 percent of the highland population. If 80,159 was seventeen percent, the Republic’s working denominator was about 470,000. The same study gives 596 strategic hamlets in the highlands, into which 153,422 highlanders were resettled. See Strategic hamlets and relocation.
The dead
Nobody counted. That is the first and most important thing to say, and everything that follows is an estimate made afterward by people working from what they had seen.
Hickey’s summation is the one the scholarship rests on. He gave it in Shattered World: Adaptation and Survival among Vietnam’s Highland Peoples during the Vietnam War (University of Pennsylvania Press, 1993), at page 261: 200,000 to 220,000 highlanders dead; about 85 percent of highlanders driven from villages that were destroyed or left in ruins; and, for the Bru, the Pacoh and the Katu, not one house remaining. He said it again in his own voice nine years later, in the epilogue to Window on a War:
“The North Vietnamese, South Vietnamese, Viet Cong, and Americans had brought vast death and destruction to the mountain country. At least 200,000 highlanders had died and eighty-five percent of their villages had either been abandoned or destroyed. The ethnolinguistic maps of 1956 were now hopelessly out of date.”
“The Americans, who had used the highlanders, were abandoning them to a dark future. Bishop Seitz had been all too accurate when, in February 1973, he declared to me that the highlanders were ‘between zero and infinity.’”
Paul Seitz was the Bishop of Kon Tum, and he had been in the highlands since 1952. Between zero and infinity is the best sentence anyone has written about how many of us there are. It is a churchman in February 1973 saying in four words exactly what this page is about. See The Kon Tum mission.
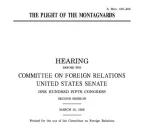
Our own community gives a higher figure: more than a million of our people killed, and eighty-five percent of our villages destroyed or abandoned, as a Dega witness told the US Senate Committee on Foreign Relations on March 10, 1998.
Set the two beside each other honestly and they are the same kind of thing. Hickey’s 200,000 is an estimate published without its working, by a careful man who was there. The million is an estimate published without its working, by the people it happened to. Since 1975 no independent observer has been free to count our dead, so neither figure can be checked against a register, because no register was kept and the not-keeping was a policy. We print both, we say which is which, and we do not pretend that the smaller number is the more serious one because a university press carried it. See The memorial register and What we do not know.
What can be evidenced from a document rather than a memory is displacement, and it is in Carrier’s paper, taken from the Republic of Vietnam’s statistical yearbook for 1970.
| Province | Highlanders | Ethnic Vietnamese | Vietnamese share | Refugees resettled by Dec. 31, 1970 |
|---|---|---|---|---|
| Darlac | 100,920 | 66,319 | 39.7% | 82,119 |
| Pleiku | 90,092 | 28,537 | 24.1% | 58,477 |
| Kontum | 61,244 | 11,356 | 15.6% | 51,474 |
| Tuyen-Duc | 53,614 | 48,310 | 46.3% | 11,671 |
| Phu-Bon | 48,358 | 4,518 | 8.6% | 74,841 |
| Long-Khanh | 35,915 | 40,421 | 53.0% | 65,412 |
| Lam-Dong | 32,587 | 37,072 | 53.2% | 19,523 |
| Quang-Ngai | 22,239 | 21,770 | 49.5% | 232,587 |
| Binh-Long | 20,248 | 21,970 | 54.2% | 20,758 |
| Phuoc-Long | 19,490 | 5,764 | 22.8% | 44,051 |
| Quang-Duc | 18,147 | 8,780 | 32.6% | 22,647 |
| Binh-Thuan | 14,025 | 3,961 | 22.0% | 16,082 |
| Total | 516,879 | 298,788 | 36.6% |
Read the last column against the first. Phu Bon had 48,358 highlanders and 74,841 people resettled as refugees. Phuoc Long had 19,490 highlanders and 44,051 refugees. The refugee column is not all highlanders. But that is what eighty-five percent of villages abandoned or destroyed looks like when it reaches a statistical yearbook. The province names in this table are the ones the Republic used; four of them no longer exist. See Highland refugees of the war.
The other half of the arithmetic
A share has two numbers in it, and ours fell because the other one rose. This is the sequence, and every figure in it has a publisher outside Vietnam.
1940. Before anything: about 750,000 of us, against 35,000 Vietnamese and 5,000 French, most of the latter two in rubber and in the mission stations. The figure is attributed to Salemink’s The Ethnography of Vietnam’s Central Highlanders (2003) in the reference literature; we have not held the book and mark it as needing the printed page.
1953. The Central Intelligence Agency, looking back in 1966: “An estimate of 1953 showed only 6,000 Vietnamese in the Highlands, apparently excluding the Dalat area.” On the other side of the same ledger, the State of Vietnam counted roughly 500,000 highland people in the Crown Domain that year. See The years between.
1955. “By 1955 there were 80,000 Vietnamese in the Highlands, primarily around Dalat, Route 20 in Haut Donnai … and the towns of Banmethuot and Kontum.” Thirteen times as many as two years before.
1956. “By the end of 1956 more than 140,000 Vietnamese refugees had settled on tribal lands.” This is the dinh điền land development program beginning. See How we got pushed off.
1959 to 1962. More than 25,000 Vietnamese resettled in Pleiku by 1959; more than 20,000 in Kon Tum by 1960; over 54,000 in Darlac by 1962. Hickey gives the land side of it: by 1960 some 51,695 Vietnamese had been settled on 21,186 hectares, most of it near Buon Ma Thuot and Pleiku. Four tenths of a hectare each, on our swidden land. See Land law and customary land.
1963. “By 1963 Vietnamese accounted for more than 40 percent of the population in the seven provinces of Kontum, Pleiku, Phu Bon, Darlac, Quang Duc, Tuyen Duc and Lam Dong.” Ten years after the six thousand.
1976. And then the sentence that is this article’s spine, from Salemink’s report for UNHCR: “Between 1976 and 2001 the population of the four provinces of the Central Highlands more than tripled from 1.2 million to over 4 million, with the indigenous population growing from 600,000 to approximately one million.” Half in 1976. Under a quarter in 2001. Twenty-seven words.
1975 to 1980. The New Economic Zones. Minority Rights Group International reports that by 1975 an estimated one million people, mainly ethnic Kinh, had been relocated into areas previously the domain of highland peoples, and that after 1975 perhaps as many as three million moved into the region. MRG gives no source for either figure and we attribute them to MRG rather than launder them. See The great migration.
1990 to 2000. The Central Highlands grew by 58.4 percent in ten years against a national average of 17.7 percent — the fastest growth of any region in Vietnam. Density went from 49 to 78 people per square kilometer.
The coffee years, in one sentence from the World Bank: “Dak Lak province currently has over 40 different ethnic minorities now resident there, as a result of high rates of in-migration, whereas 30 years ago there were only three or four ethnic groups.” That sentence makes the point that the word “minority” hides. Most of the new minorities in Dak Lak are Tay, Nung, Muong, Hmong and Dao from the north, who arrived as settlers. See Land taken for coffee.
How many is visible in the UNFPA analysis of the 2009 census: in the Central Highlands that year there were 3,309,836 Kinh, 104,798 Tay, 40,556 Thai, 35,544 Muong and 2,436 Khmer, in a region of 5,115,135. Kinh were 64.7 percent and minorities 35.3 percent — but at least 180,000 of those minorities, in the four largest northern groups alone, were settlers themselves. The genuinely indigenous share was lower than 35 percent, and the report does not say how much lower.
One curiosity worth recording, because this page is about how hard it is to get a number right. The narrative text of that same UNFPA report states that Kinh are “84.7 per cent in the Central Highlands.” Its own table, on the same page, gives 3,309,836 of 5,115,135, which is 64.7. A digit was transposed in the flagship analysis of Vietnam’s ethnic census data published by a United Nations agency, and it stands uncorrected. Even the careful sources are not careful.
2019. The census counted 96,208,984 people in Vietnam, of whom 82.1 million were Kinh; the Central Highlands held 5.8 million, 6.1 percent of the country. UN Women, working from the government’s survey of the fifty-three minorities, puts the ethnic-minority population of the region at 2.2 million — 37.7 percent of it, and again including the northern settler minorities.
The share, census by census
Here is what can be evidenced, with the holes left in. Every dash is a cell we looked for and could not fill from a source we are willing to cite.
| Year | Region | Indigenous | Share | Source |
|---|---|---|---|---|
| 1940 | — | 750,000, against 35,000 Vietnamese and 5,000 French | about 95% | Salemink 2003, at second hand; unverified |
| 1943 | — | — | — | Not found. See below |
| 1953 | — | about 500,000 in the Crown Domain; 6,000 Vietnamese in the highlands | about 99% | Goscha; CIA, June 1966 |
| 1955 | — | 80,000 Vietnamese | — | CIA, June 1966 |
| 1963 | — | — | Vietnamese above 40% in seven provinces | CIA, June 1966 |
| 1970 | 1,561,781 in twelve provinces | 516,879 | 33.1% | RVN yearbook, via Carrier 1974 |
| 1976 | 1,200,000 in four provinces | about 600,000 | about 50% | Salemink for UNHCR, 2001 |
| 1979 | — | 939,453 nationally, nineteen peoples | — | World Bank, 2009 |
| 1989 | — | 1,250,683 nationally, nineteen peoples | — | World Bank, 2009 |
| 1999 | 4,058,603 in four provinces | 1,347,982 “ethnic minorities” | 33% | WriteNet for UNHCR, 2006 |
| 2001 | over 4,000,000 | about 1,000,000 | under 25% | Salemink for UNHCR, 2001 |
| 2009 | 5,115,135 in five provinces | 1,805,299 “ethnic minorities” | 35.3%, indigenous share lower | UNFPA, 2011 |
| 2019 | about 5,800,000 | 2,200,000 “ethnic minorities” | 37.7%, indigenous share lower | UNFPA 2019; UN Women 2021 |
For one year only there is a published table of the highland provinces with their minority shares, and it is worth printing whole. From the WriteNet report for UNHCR of June 2006, on the 1999 census:
| Province | Total | Kinh | Ethnic minority | Minority share |
|---|---|---|---|---|
| Kon Tum | 313,285 | 145,681 | 167,604 | 54% |
| Gia Lai | 966,934 | 545,048 | 421,886 | 44% |
| Dak Lak, including what is now Dak Nong | 1,780,644 | 1,250,494 | 530,150 | 30% |
| Lam Dong | 997,740 | 769,398 | 228,342 | 23% |
Only Kon Tum still had a minority majority in 1999, and the World Bank noted ten years later that it was still the only one — and that even there the Kinh were the largest single group. Nobody has published the same table for any later census.
And then the denominator was abolished
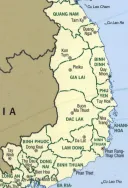
Under Resolution 202/2025/QH15, with effect from July 1, 2025, Vietnam reduced its provinces and cities from sixty-three to thirty-four. Kon Tum was merged into Quảng Ngãi. Bình Định was merged into Gia Lai. Phú Yên was merged into Dak Lak. Đắk Nông and Bình Thuận were merged into Lâm Đồng. There is now no administrative unit in Vietnam that corresponds to the Central Highlands.
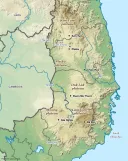
The consequence for this page is exact. From 2025 onward, no published provincial statistic measures the indigenous share of the highlands. The denominator runs to the South China Sea. A future census of Gia Lai will report our number against a population that includes Quy Nhơn; a census of Dak Lak against one that includes Tuy Hòa; a census of Lâm Đồng against one that includes Phan Thiết. Whatever the intention, the effect is that the one quantity this article exists to track has been administratively dissolved. See Our territories and Map of the highlands.
The smallest peoples
| People | 1979 | 1989 | 1999 | 2009 | 2019 |
|---|---|---|---|---|---|
| Ro Mam | 143 | 227 | 352 | 436 | 639 |
| Brau | 95 | 231 | 313 | 397 | 525 |
| O Du | 137 | 32 | 301 | 376 | 428 |
The O Du are not a highland people. They live in Nghệ An, far to the north, and they are in this table for one reason: their line is the most eloquent number in the whole census. In 1979 the count found 137 O Du. In 1989 it found thirty-two. In 1999 it found 301. No plague did that and no massacre did that. A category did it. If an enumerator’s decision can take a people from 137 to 32 and back to 301 inside twenty years, nothing further needs to be said about what a census of a small people measures.
The Ro Mam live in one village — Le, in Mo Rai commune, Kon Tum — and there were 639 of them in 2019. The Brau live at the three-way border with Laos and Cambodia, 525 of them; and most Brau are not in Vietnam at all but in Ratanakiri, on the Cambodian side of a line drawn through them, where they are counted as Brao. For peoples of this size the census is not a statistical instrument. It is a roll call, and its margin of error is one household. See The smaller peoples.
Abroad, and across the border
Cambodia is not a diaspora
The Jarai of Ratanakiri and the Bunong of Mondulkiri did not leave. A border arrived. Cambodia’s 2019 census, as compiled in the national report on indigenous peoples published by the Ministry of Planning with the Cambodia Indigenous Peoples Alliance in 2024, counted 172,980 indigenous people in twenty-two peoples — 1.11 percent of the country, and 3.5 percent fewer than in 2008. Among them:
| People | Cambodia, 2019 |
|---|---|
| Bunong (Mnong) | 36,585 |
| Tampuan | 36,363 |
| Jarai | 26,922 |
| Kreung | 21,453 |
| Kui | 16,762 |
| Stieng | 4,980 |
The largest indigenous people in Cambodia are the Bunong, and the Bunong are Mnong. Thirty-six and a half thousand in Cambodia against 127,334 in Vietnam: one people, a fifth of whom are counted by a different state, in a different language, under a different name. That is what a national census does to a people that a border runs through. See Kin across the border and Mondulkiri, 1992.
One figure in circulation should be set right. The Jarai are not 23 percent of Ratanakiri. The figure in the literature, from an Asian Development Bank survey of 1996, is that the Jarai are about 24 percent of the Khmer Loeu — the highland — population of the province, and the Khmer Loeu were about half of Ratanakiri in 2013. The Jarai are therefore roughly twelve percent of the province, and the largest indigenous people there are the Tampuan.
The United States, and how a number grows
No census anywhere has ever asked how many Montagnards there are in America. The United States Census Bureau has no such category, and our people are recorded as Vietnamese or as Asian, other. What exists instead is a chain of estimates, each repeated from the last, and the chain is worth setting out in full because it is a case study in how a figure becomes a fact.
| Date | Source | Figure |
|---|---|---|
| March 10, 1998 | Julia V. Taft, Assistant Secretary of State for Population, Refugees and Migration, to the Senate Foreign Relations Committee | 201 resettled in North Carolina in November 1986; 398 in 1992; 1,042 approved through the Orderly Departure Program out of 2,504 found eligible since 1985; more than 1,600 admitted as refugees since the late 1970s |
| 2002 | Raleigh Bailey, The Montagnards: Their History and Culture | About 3,000 in North Carolina — roughly 2,000 near Greensboro, 700 in Charlotte, 400 in Raleigh |
| 2006 | NCpedia, State Library of North Carolina | “Approximately 3,000” — Bailey’s figure, six years old, now applied to the whole United States |
| 2018 | Center for New North Carolinians, University of North Carolina at Greensboro | “Between 10,000 and 20,000” locally |
| 2019 | H. Res. 435, 116th Congress | “An estimated several thousand” |
| April 2019 | VFW Magazine | About 5,000 in North Carolina, about half near Greensboro |
| May 2021 | Montagnard Dega Association of Greensboro, in Triad City Beat | More than 12,000 in the United States |
| 2023 | A peer-reviewed paper in F1000Research | “Over 12,000” — cited to Bailey, 2002, which says three thousand |
The last line is how it happens. A 2023 paper in a peer-reviewed journal attributes a figure of twelve thousand to a source that gives three thousand, and that citation will now be copied by everyone who reads it. Nobody involved did anything dishonest. The community grew, the old figure felt wrong, a newer one was to hand, and the footnote went to the book everybody cites.
The honest position is this. The only numbers that are counts rather than estimates are the arrivals: about 201 in November 1986, about 400 in 1992, about 900 in 2002, and 1,042 approved through the Orderly Departure Program by 1998. Everything above that is births, family reunification and secondary migration, and no one has counted them. Somewhere between five and twelve thousand is the range an honest person can defend today. The waves themselves are disputed in the margins — 201, 212 or 200 in 1986; 398, 400, 402 or 417 in 1992 — and the year of the first wave is disputed too, though November 1986 is better attested than the 1988 that sometimes appears. See North Carolina, The wider diaspora and The 2002 resettlement.
Thailand, Finland, and the rest
Approximately 1,700 Vietnamese and Montagnard refugees were in Thailand across six groups as of September 2022, the Montagnards among them from Gia Lai and Dak Lak; an earlier count put more than 600 Montagnards in Bangkok as urban refugees. See Thailand: screening and the long wait and Asylum today.
Finland accepted seventy-two Montagnards from Cambodia in 2005; the first twenty-seven left Phnom Penh on May 11 that year. Some went to Sweden, and Canada was beginning to accept Montagnards at that time. These are precise numbers only because UNHCR announced them.
The closing arithmetic of the Cambodian camps, from UNHCR’s own review in June 2006: 102 voluntary returnees to Vietnam and 94 involuntary deportees, 190 returned in all; 605 resettled in third countries; 249 still under UNHCR care in Phnom Penh. Of the 2001–2002 caseload, 905 were resettled in the United States, 76 percent of them men. See The Cambodian camps.
For France, Canada and Sweden there is no published count of any Dega community at all. Figures of about 10,000 Bahnar in the United States and 5,000 in France are sometimes quoted; they come from the summary box of an encyclopedia article that cites nothing for them, and a figure of 3,000 Koho in the United States travels the same way. We do not use them, and we say where they come from so that others can stop using them too.
Why nobody can simply count us
The highlands are closed. Human Rights Watch opened its 2002 report on the region by saying that its scope was limited because access to the Central Highlands is tightly restricted by the government of Vietnam, making it difficult for independent observers such as human rights monitors and journalists to verify data on conditions there. That was written by the best-resourced outside investigation of the region there has been. See Sources and method.
The counter has an interest in the count. Salemink’s report for UNHCR carries a footnote worth more than a page of argument: figures tend to be notoriously unreliable, he writes, and there is an incentive for officials to report favorable results to higher levels of government. Set that beside the American handbook’s note that Saigon’s estimates of the Mnong ran low and Hanoi’s ran high, and the pattern is old and general rather than particular to one government.
The categories are not ours. The list of fifty-four was made in 1979 by people who were not us, on criteria we did not choose, and it has never been reopened.
The region has been dissolved. Since July 1, 2025 there is no Tay Nguyen to be a share of.
And the places to check are closing. The World Factbook, long one of the standard non-Vietnamese places to find Vietnam’s ethnic composition, was discontinued in February 2026. One fewer independent shelf on which to find the same state figure.
Terms
- Dân tộc — the unit the census counts in. The word carries “nation,” “people” and “ethnic group” at once, which is why “ethnic minority” is a translation and a claim in the same breath.
- Đồng bào dân tộc thiểu số — the formula in which we appear in official texts. Useful to anyone searching the record.
- Decision 121-TCTK/PPCD — the Nomenclature of Vietnamese Ethnic Groups, March 2, 1979. The instrument that made fifty-four.
- Tây Nguyên — “western highlands,” the state’s name for the region, and until July 1, 2025 one of Vietnam’s six socio-economic regions.
- Khmer Loeu — “upper Khmer,” Cambodia’s collective term for the indigenous peoples of its northeast, including Bunong, Jarai, Brao and Stieng. The Cambodian counterpart of “Montagnard,” and the reason one people appears in two statistical systems under two collective names.
- Dinh điền — the land development centers of the Diem years.
- Vùng kinh tế mới — the New Economic Zones of the years after 1975.
What we still cannot fill in
A French colonial count for 1943 is the most obvious hole. We searched the digitized French collections and the standard reference works for a population figure for the Pays Montagnards du Sud-Indochinois and found none; the statistical yearbooks of Indochina for the middle 1940s are the place to look, and so are the population tables in Hickey’s Sons of the Mountains, which we have not been able to open.
Andrew Hardy’s Red Hills: Migrants and the State in the Highlands of Vietnam is the book that would let the migration section be written from research rather than assembled from reports, and we could not get into a copy. Masako Itō’s Politics of Ethnic Classification in Vietnam would do the same for the section on the list of fifty-four. Neither is quoted above because neither has been read.
And for 2019 there is no per-province indigenous share published anywhere outside Vietnam. The 1999 table above is the last one that exists. After 2025 there will not be another. See What we do not know.
- World Bank, Country Social Analysis: Ethnicity and Development in Vietnam (Washington DC, 2009) — Table 2.1, the 1979/1989/1999 series for all fifty-four groups; pp. 11–13 on how the classification was made and Decision 121-TCTK/PPCD; Table 2.2 on regional growth 1990–2000; pp. 24 and 27 on the Central Highlands and on Dak Lak’s forty minorities
- Oscar Salemink, Vietnam: Indigenous Minority Groups in the Central Highlands, WRITENET Paper No. 05/2001 (UNHCR Centre for Documentation and Research, January 2002) — the 925,000 to 1,625,000 series; the 1976–2001 sentence; household size and Jarai life expectancy; the footnote on data reliability
- WriteNet, Vietnam: Situation of Indigenous Minority Groups in the Central Highlands (UNHCR, Status Determination and Protection Information Section, June 2006) — the 1999 per-province table and the accounting of the Cambodian caseload
- UNFPA Viet Nam, Ethnic Groups in Viet Nam: An analysis of key indicators from the 2009 Viet Nam Population and Housing Census (2011) — Table 3, the regional distribution, and the 84.7 that should read 64.7
- UN Women Viet Nam, Figures on Ethnic Minority Women and Men in Viet Nam (2021) — 2.2 million minority people in the Central Highlands, 15.6 percent of the national minority population
- Committee on the Elimination of Racial Discrimination, CERD/C/VNM/15-17, Viet Nam’s combined fifteenth to seventeenth periodic report, submitted January 13, 2021 — 96,209,000 total; 14,119,000 in fifty-three minorities
- Central Intelligence Agency, Vietnamese Affairs Staff, The Highlanders of South Vietnam: A Review of Political Developments and Forces, June 1966 (CIA-RDP80T01719R000300010003-8) — the 500,000 to 1,000,000 range, the working figure of about 700,000, and the settler series from 1953 to 1963. Read in full from the declassified text
- Joseph M. Carrier, “Estimating the Highlander Population Affected by Herbicides,” in The Effects of Herbicides in South Vietnam, Part B: Working Papers (National Academy of Sciences – National Research Council, February 1974) — the range, the Republic’s series, and Table I on the twelve provinces in 1970
- Gerald C. Hickey, Accommodation and Coalition in South Vietnam, RAND P-4213 (1969), pp. 44–45 — the 642,855 and the “close to 1,000,000”
- Gerald C. Hickey, The Major Ethnic Groups of the South Vietnamese Highlands (Advanced Research Projects Agency, April 1964) — per-people estimates, and 51,695 settlers on 21,186 hectares by 1960
- Gerald Cannon Hickey, Shattered World: Adaptation and Survival among Vietnam’s Highland Peoples during the Vietnam War (University of Pennsylvania Press, 1993), p. 261 — the 200,000 dead and the 85 percent. We have this page through the scholarship that cites it and have not held the book
- Gerald C. Hickey, Window on a War: An Anthropologist in the Vietnam Conflict (Texas Tech University Press, 2002) — the epilogue, and Bishop Seitz on “between zero and infinity”
- Minority Groups in the Republic of Vietnam, Ethnographic Study Series, Department of the Army Pamphlet 550-105 (1966) — the per-people figures and the passage on North and South Vietnamese estimates of the Mnong
- Human Rights Watch, Repression of Montagnards: Conflicts over Land and Religion in Vietnam’s Central Highlands (April 2002) — p. 3 on access, p. 13 on the million and the quarter
- Minority Rights Group International, World Directory of Minorities and Indigenous Peoples — Vietnam: Highlanders (March 2018) — the 1 to 2 million, and the migration figures, given without sources
- Ministry of Planning and the Cambodia Indigenous Peoples Alliance, National Report on the Demographic and Socio-Economic Situation of Indigenous Peoples in Cambodia: Update 2024 — the 2019 Cambodian census, 172,980 people in twenty-two peoples
- Stan B-H Tan, “Swiddens, Resettlements, Sedentarizations, and Villages: State Formation among the Central Highlanders of Vietnam under the First Republic, 1955–1961,” Journal of Vietnamese Studies 1, nos. 1–2 (2006) — the 80,159 sedentarized and the strategic hamlet figures
- Christopher Goscha, “Pays Montagnards du Sud,” Guerre d’Indochine historical dictionary, Université du Québec à Montréal — the State of Vietnam’s estimate of 500,000 in the Crown Domain in 1953
- Julia V. Taft, statement before the Senate Foreign Relations Committee, March 10, 1998; H. Res. 435, 116th Congress (2019); NCpedia (2006); the Center for New North Carolinians at UNC Greensboro (June 19, 2018); VFW Magazine (April 2019); Triad City Beat (May 12, 2021); McGinley, Ksor and Bush in F1000Research 12:1549 (2023) — the chain of American estimates set out above
- Grace Bui, “The Resettlement of Vietnamese and Montagnard Refugees Residing in Thailand,” National Bureau of Asian Research, September 10, 2022; UN News, May 11, 2005, on the Finnish resettlement
- Resolution 202/2025/QH15 of the National Assembly, in force July 1, 2025 — the merger of sixty-three provinces and cities into thirty-four, and with it the end of the Central Highlands as an administrative region
Compiled September 2026. The census figures on this page are the Vietnamese state’s own, reproduced from the World Bank, UNFPA, UN Women and UNHCR publications that carry them, because they are the only systematic count that exists and not because we accept the categories they use. Totals for the thirteen and the nineteen peoples are our own arithmetic on those tables and are shown so that anyone can check them. Where a figure comes to us through a source that is itself quoting another, we say so. Figures nobody has settled — the colonial-era three million, the war dead, the size of the American community — are given with what stands for and against them rather than settled, and that includes the figures on both sides: Hickey’s 200,000 was published without its working too.